By Jelena Golubović, Kathleen Inglis, and Cheyanne Connell
This supplement provides additional information about the data, methods, and findings in our article “Gendered Disruptions in Academic Publishing during COVID-19: Uncovering Invisible Labor at an Anthropology Journal,” published in American Ethnologist (vol. 49, no. 4). It also includes all the tables and graphs produced during our research, including those that appear in the article. By collating the data here, we hope to encourage other peer-reviewed journals to conduct similar studies. We also aim to provide comprehensive data on gendered disruptions of productivity that women in academia can use to advocate for themselves.
Supplementary information on our data
American Ethnologist uses an editorial software called ScholarOne to process virtually all manuscript submissions and reviews. For this study, AE and its parent organization, the American Anthropological Association, granted us access to ScholarOne-generated data on reviewer and author activity from 2014 to 2021.
Reviewer activity data consisted of all review invitations sent out by the journal during this period, as well as reviewer responses to the invitations, which were simplified into two categories: accept and decline. In practice, the “decline” category is more multifaceted, including invitations that went unanswered and those that were declined owing to conflicts of interest. The “accept” category is also more complex, including both reviewers who accepted and completed reviews, as well as reviewers who accepted invitations but, for any number of reasons, never completed the requested reviews. To capture these complexities, reviewer data also included the duration of each review, counted as the number of days from when the reviewer accepted the invitation and when they submitted their review. We did not gather any data about reviewer evaluations of manuscripts, that is, whether they recommended publication, revision, or rejection.
Author activity data consisted of article manuscripts submitted to the journal for consideration from 2014 to 2021. Book reviews were excluded because they do not undergo peer review. For the purpose of this study, we included only initial manuscript submissions and did not count revised versions of manuscripts. This was to ensure that we really were measuring author productivity and not polluting this concept with other possible factors that may be correlated with the number of manuscript revisions. The number of manuscript revisions may be correlated, for example, with the strength or weakness of a particular manuscript (i.e., whether it was sent out for review and how many rounds of review it required), or it may be associated with the editorial practices of different AE editors, who may have been more or less prone to request revisions; our data set encompassed three editorships (2011–15, 2015–19, and 2019–22).
Although we included only initial manuscript submissions, we included all reviewer activity, including invitations to review revised versions of manuscripts. This is because while one single paper can undergo four rounds of revision, it ultimately results in only one research output, if any. Meanwhile, the four rounds of revision all require separate service requests to reviewers. In total, our data set consisted of 13,151 entries (11,266 reviewer entries and 1,885 author entries).
Supplementary information on our methods
About 20 percent of the ScholarOne data set contained gender data. To fill in gender, we used genderize.io (https://genderize.io), a web-based API. The genderize.io database contains over 250,000 names collected across 79 countries and 89 languages (Santamaría and Mihajlević 2018). Taking a list of first names as its input, it outputs inferred genders (female, male, ornone) as well as a confidence measure for each entry ranging from 0 to 1 probability.
For all entries under 0.96 probability (as well as for random entries from 0.96 to 1 probability), we manually “checked” the algorithm’s result. Manually checking entries involved searching the internet to find the author or reviewer’s faculty profile or professional web page, and confirming that the gender pronouns used on those pages were consistent with the algorithm’s results. In eight cases, our internet searches did not lead us to current and publicly available pronouns, so we withdrew these eight entries from our data set.
Manually checking entries was extremely time consuming. But because the data was organized into annual segments, many authors and reviewers appeared multiple times (e.g., someone who reviewed a manuscript in 2020 and 2019 and submitted a manuscript in 2017 would appear in the 2020 and 2019 reviewer data as well as in the 2017 author data). The annual organization of the data allowed us to speed up the process by working in one-year segments. We genderized and manually checked the 2014 data and then used Python to map the “verified” data onto the next one-year segment, and so forth until 2021.
To assess the accuracy of our data set, we cross-checked our final “genderized” data set against the ScholarOne gender data. Instead of initially separating out the 20 percent of entries that already included ScholarOne gender data, and applying the algorithm to only the remaining 80 percent, we had applied the algorithm to the entire data set and performed manual checks on all entries classified below 0.96 probability—whether or not they included ScholarOne gender data. This enabled us to check our error rate by cross-checking our newly genderized data set against the self-reported gender data in ScholarOne. Out of 2,656 corresponding entries (20.2 percent of the data set), we had misgendered five. These five were names that the algorithm had classified as of 0.96 to 1 probability, and they were not caught by our random checks above 0.95. This placed our error rate at an extremely low 0.19 percent. Had the error rate been higher, we would have proceeded to manually check all entries classified as 0.96, then 0.97, and so on, until the error rate fell into an acceptably low range.
Comprehensive tables and graphs
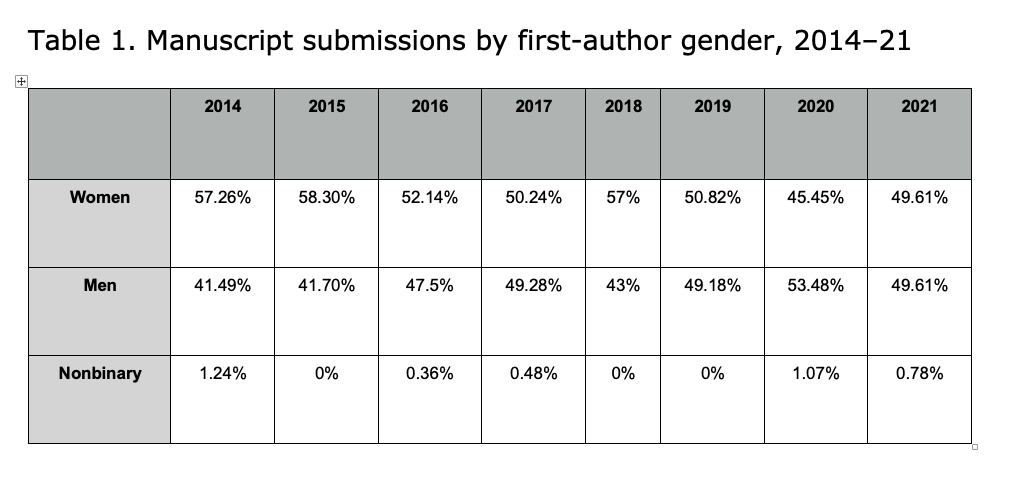
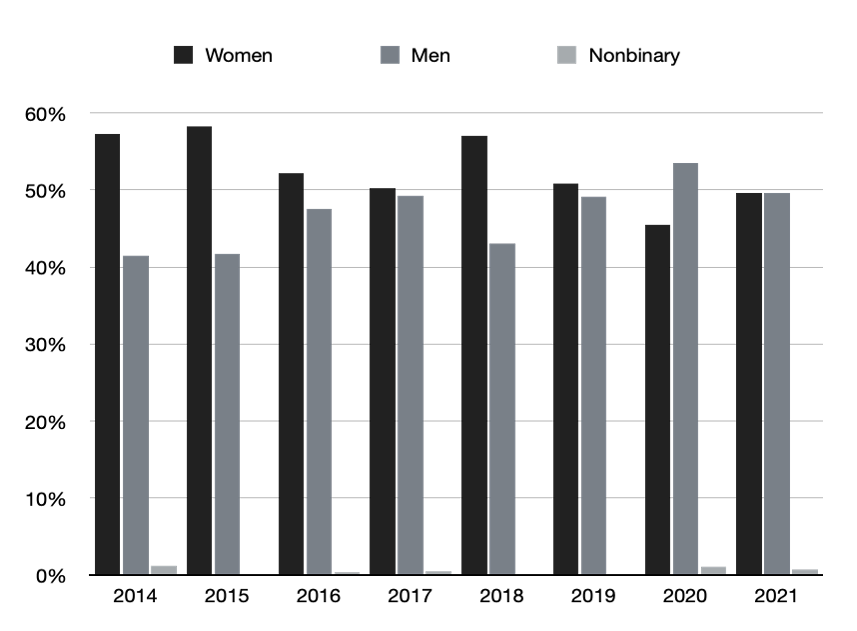
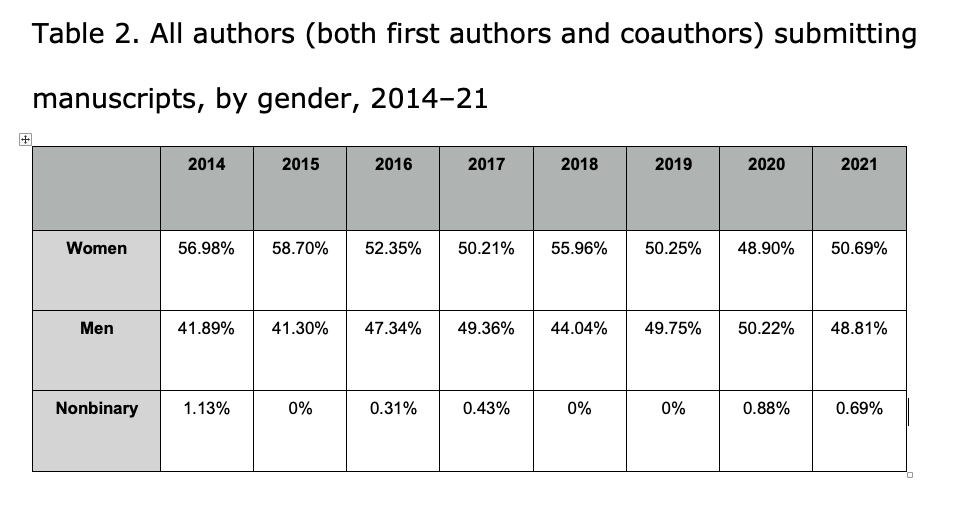
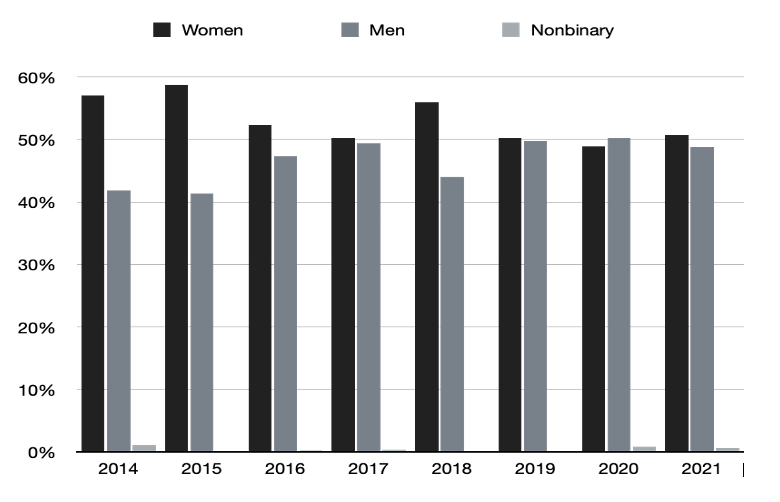
Note: This data includes only initial manuscript submissions, not revised versions of manuscripts.
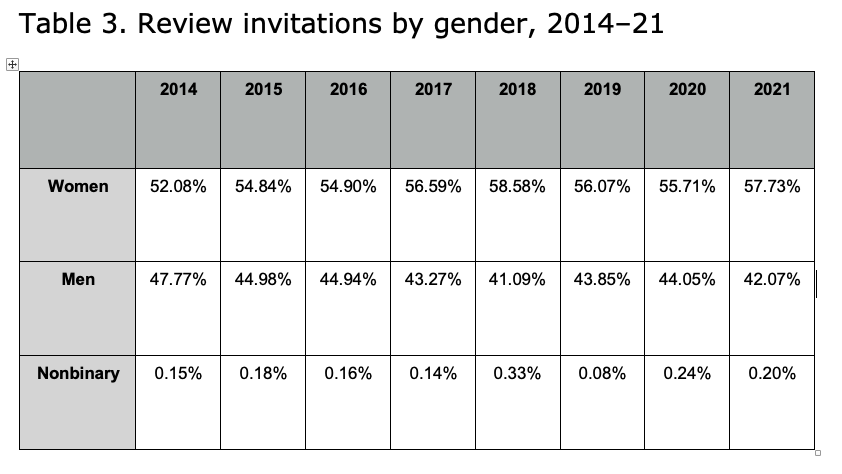
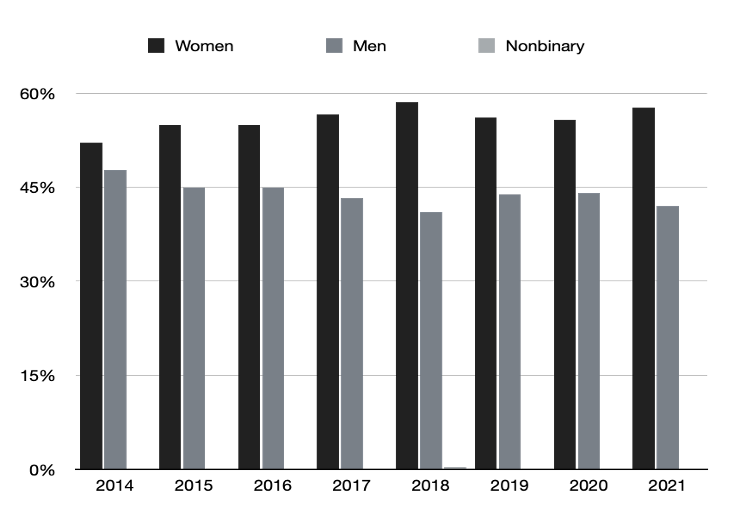
Note: This data includes review invitations sent by the journal from January 1 to December 31 each year, regardless of when potential reviewers replied (or did not reply) to those invitations.
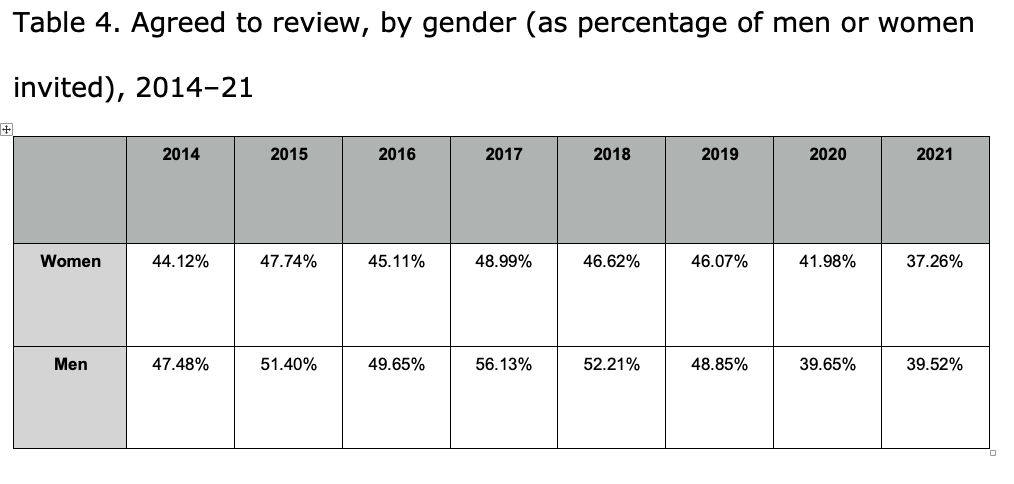
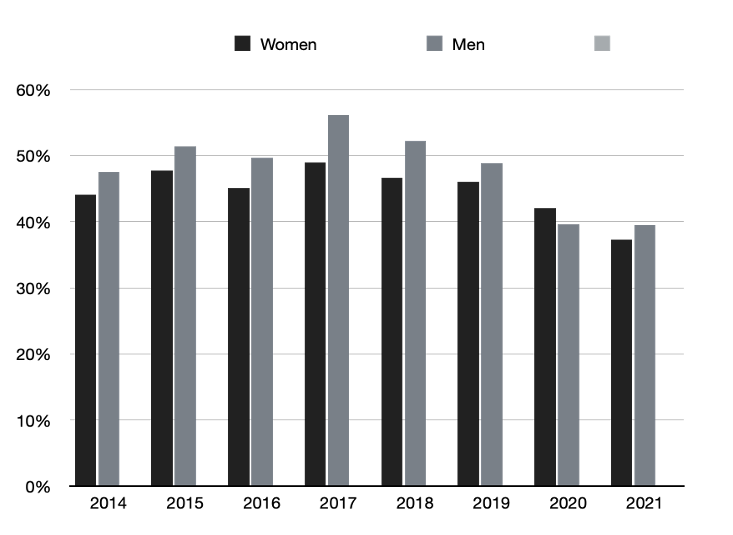
Note: This data includes responses to invitations sent out from January 1 to December 31 of each year, regardless of when those responses were registered. For instance, if a review invitation was sent out on December 31, 2014, and the reviewer did not respond (agree or decline) until January 10, 2015, their response would be recorded under 2014, the year the invitation was sent.
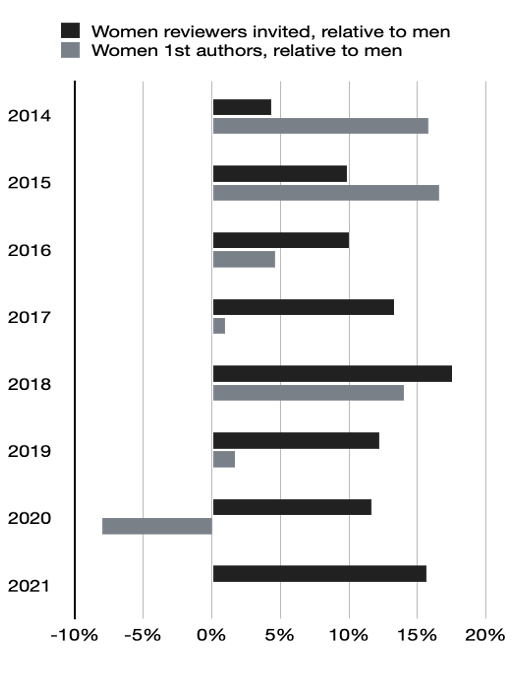
Figure 1. Relative to men, percentage of women reviewers invited and percentage of women first authors who submitted manuscripts, 2014–21
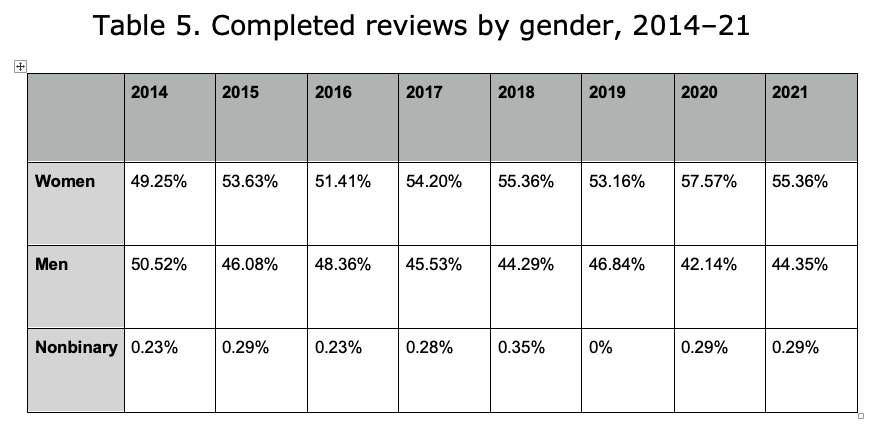
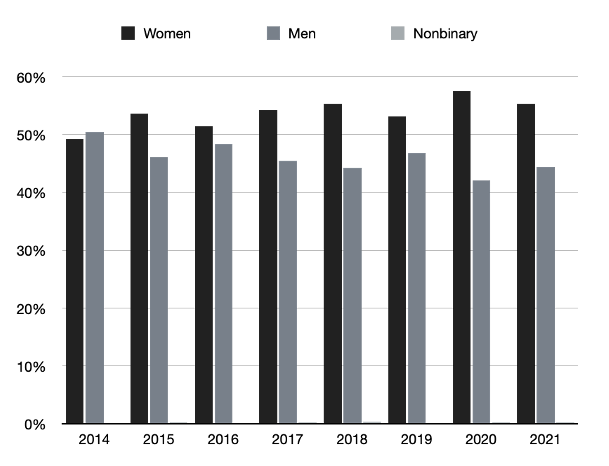
Note: This data includes reviews actually completed in each year, regardless of when the invitation was sent. If a reviewer was invited to review on December 31, 2014, and completed their review on January 10, 2015, their completion would be registered in 2015.
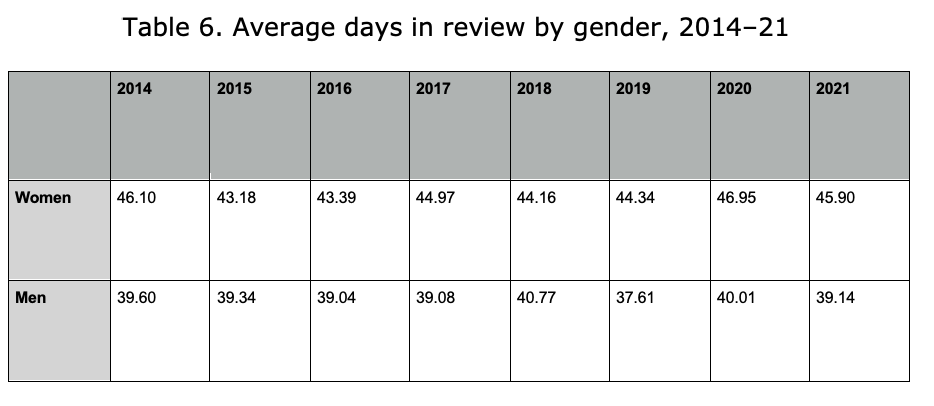
Note: This data is organized based on review completion dates. If a review that took 42 days was completed on January 10, 2015, it will be counted in 2015, even though the “days in review” spanned 2014 to 2015. The automatic deadline for AE reviews was at the time 42 days.
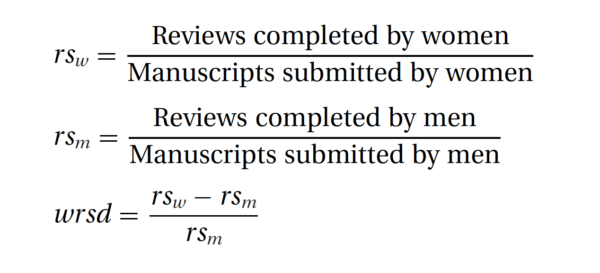
Figure 2. Women’s relative service disparity, 2014–21 (first authors)
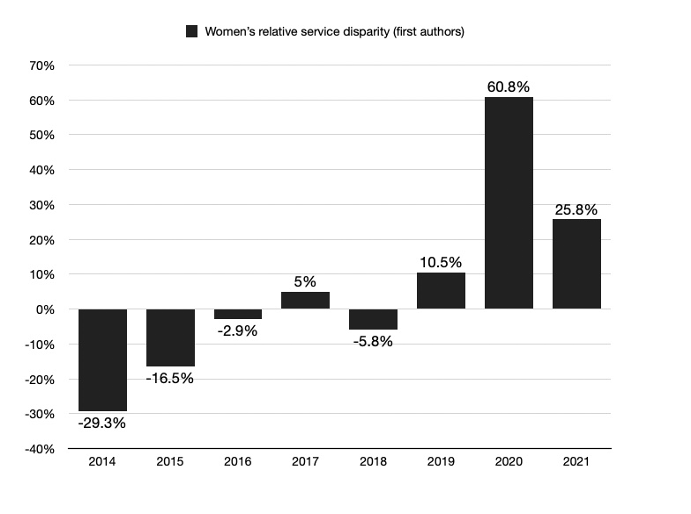
Note: We calculated women’s relative service disparity (wrsd) by calculating the difference between the rs of women (w) and the rs of men (m), and dividing it by the rs of men:
Reference
Santamaría, Lucía, and Helena Mihaljević. 2018. “Comparison and Benchmark of Name-to-Gender Inference Services.” PeerJ Computer Science 4:e156. http://doi.org/10.7717/peerj-cs.156.